Welcome to Sympy Plotting Backends’s documentation!
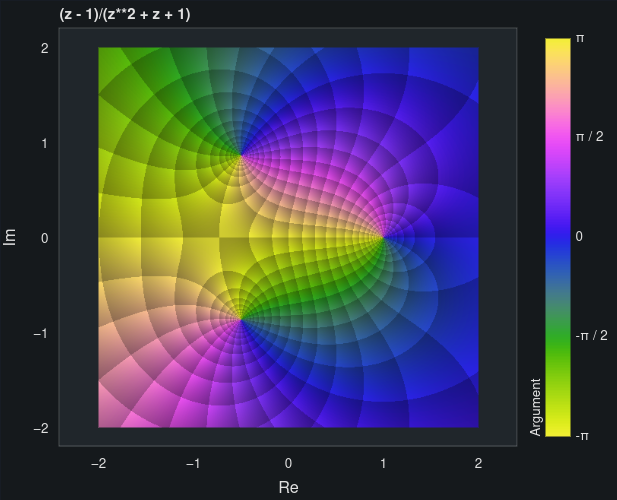
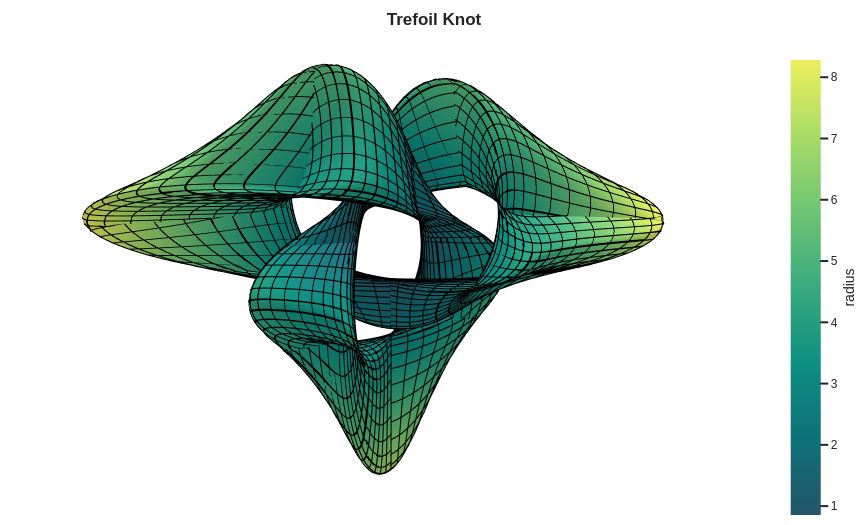
This Python module contains a few plotting backends that can be used with SymPy and Numpy. A backend represents the plotting library: it provides the necessary functionalities to quickly and easily plot the most common types of symbolic expressions (line plots, surface plots, parametric plots, vector plots, complex plots, control system plots).
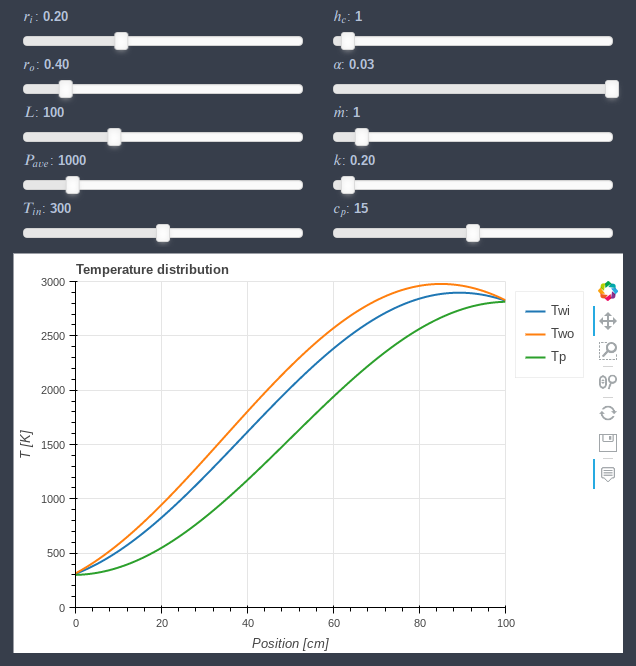
Most of the plotting functions can also automatically generates widgets (sliders, buttons, …) starting from symbolic expressions. It allows to better understand the influence of each parameters in a particular expression, without the knowledge of complicated widget libraries.
Development and Support
If you feel like a feature could be implemented, open an issue or create a PR.
If you really want a new feature but you don’t have the capabilities or the time to make it work, I’m willing to help; but first, open an issue or send me an email so that we can discuss a sponsorship strategy.
Developing this module and its documentation was no easy job. Implementing new features and fixing bugs requires time and energy too. If you found this module useful and would like to show your appreciation, please consider sponsoring this project with either one of these options: