MayaviBackend
- class spb.backends.mayavi.MayaviBackend(*args, **kwargs)[source]
A backend for plotting SymPy’s symbolic expressions using Mayavi.
- Parameters:
- aspectstr, optional
Set the aspect ratio of the plot. Default to
"equal". Possible values:"equal": sets equal spacing on the axis of a 3D plot."auto"adjust the spacing/scaling of objects.
- bg_colortuple, optional
A tuple of RGB values from 0 to 1 specifying the background color. Default to (0.22, 0.24, 0.29).
- fg_colortuple, optional
A tuple of RGB values from 0 to 1 specifying the foreground color, that is the color of all text annotation labels (axes, orientation axes, scalar bar labels). It should be sufficiently far from bgcolor to see the annotation texts. Default to (1, 1, 1), which represent white color.
- notebook_kwdict, optional
A dictionary of options to be passed to
mlab.init_notebook.- rendering_kwdict, optional
A dictionary of keywords/values which is passed to Matplotlib’s plot functions to customize the appearance of lines, surfaces, images, contours, quivers, streamlines… To learn more about customization:
- show_colorbarbool, optional
Hide or show the colorbar when a colormap is used. Default to True.
- windowbool, optional
Launch the plot on a new window. Default to False. If the environment is Jupyter Notebook and
window=False, then the plot will be inserted in the output cell.
Notes
Mayavi is difficult to install, hence that step is left to the end user. There are no guarantees that this backend works on all systems, as it has only been tested on an Ubuntu Machine with Python 3.10 with pip.
Mayavi cannot use colormaps from other plotting libraries. Hence, only use the colormap listed in [7] .
References
- MayaviBackend.fig
Returns the figure used to render/display the plots.
- spb.backends.mayavi.MayaviBackend.append(self, arg)
Adds an element from a plot’s series to an existing plot.
- Parameters:
- argBaseSeries
An instance of BaseSeries which will be used to generate the numerical data.
See also
Examples
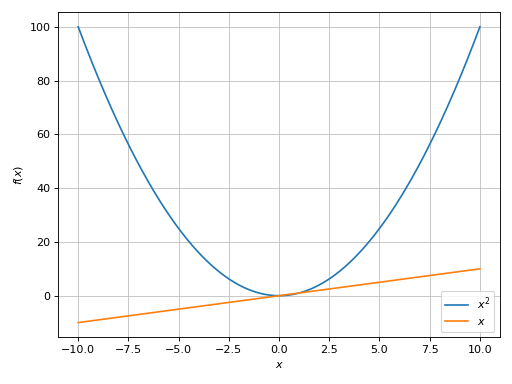
Consider two Plot objects, p1 and p2. To add the second plot’s first series object to the first, use the append method, like so:
>>> from sympy import symbols
>>> from spb import plot
>>> x = symbols('x')
>>> p1 = plot(x*x, show=False)
>>> p2 = plot(x, show=False)
>>> p1.append(p2[0])
>>> p1
Plot object containing:
[0]: cartesian line: x**2 for x over (-10.0, 10.0)
[1]: cartesian line: x for x over (-10.0, 10.0)
>>> p1.show()
(
Source code,png)
- spb.backends.mayavi.MayaviBackend.extend(self, arg)
Adds all series from another plot.
- Parameters:
- argPlot or sequence of BaseSeries
See also
Examples
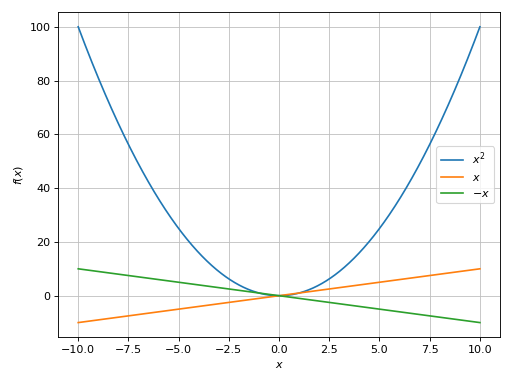
Consider two Plot objects, p1 and p2. To add the second plot to the first, use the extend method, like so:
>>> from sympy import symbols
>>> from spb import plot
>>> x = symbols('x')
>>> p1 = plot(x**2, show=False)
>>> p2 = plot(x, -x, show=False)
>>> p1.extend(p2)
>>> p1
Plot object containing:
[0]: cartesian line: x**2 for x over (-10.0, 10.0)
[1]: cartesian line: x for x over (-10.0, 10.0)
[2]: cartesian line: -x for x over (-10.0, 10.0)
>>> p1.show()
(
Source code,png)
- spb.backends.mayavi.MayaviBackend.save(self, path, **kwargs)
Save the current plot.
- Parameters:
- pathstr
File path with extension.
- kwargsdict
Optional backend-specific parameters. Refer to [8] to find more keyword arguments to control the output file.
References
- spb.backends.mayavi.MayaviBackend.show(self)
Implement the functionalities to display the plot.