Welcome to Sympy Plotting Backends’s documentation!
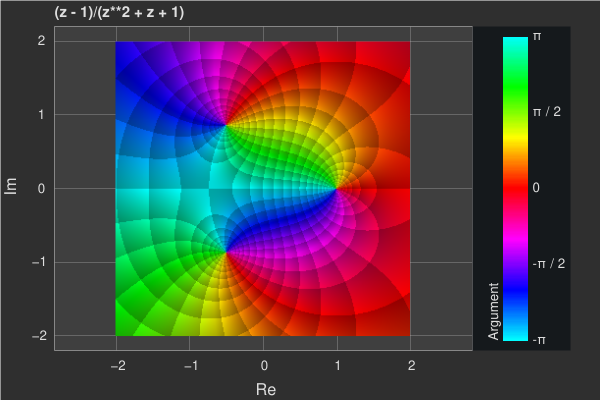
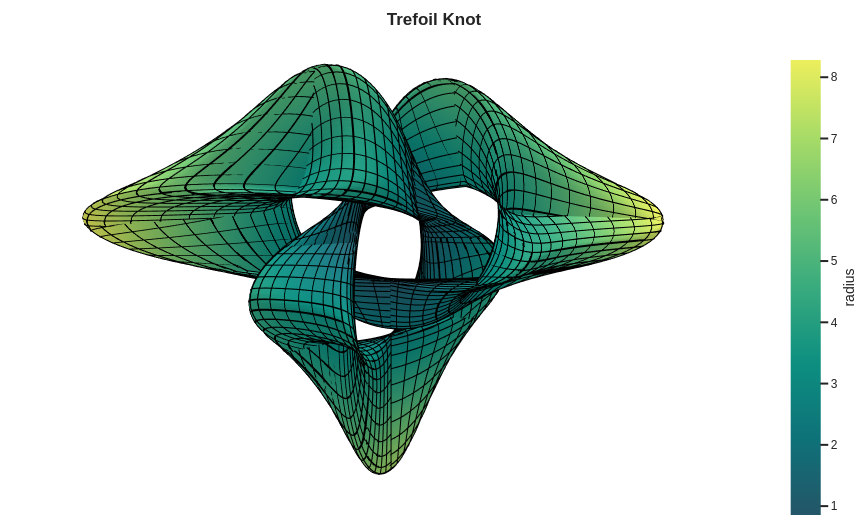
This Python module contains a few plotting backends that can be used with SymPy and Numpy. A backend represents the plotting library: it provides the necessary functionalities to quickly creates the most common types of plots, such as line plots, surface plots, parametric plots, vector plots, complex plots, geometric plots.
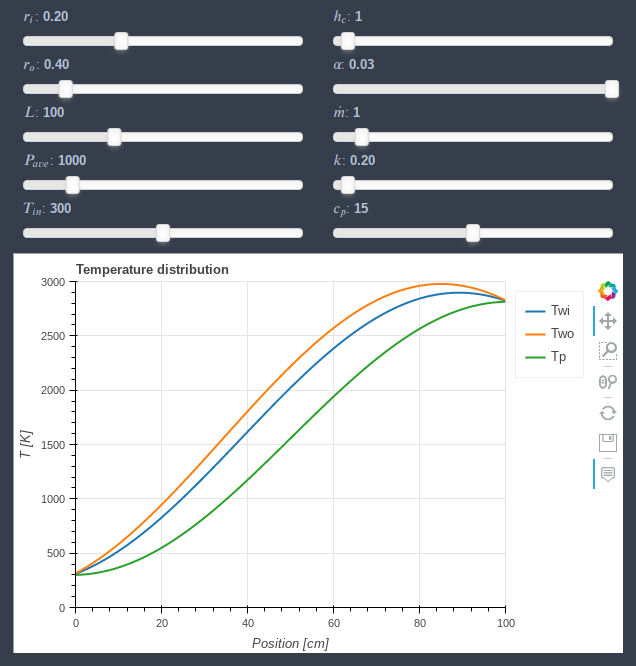
Most of the plotting functions can also automatically generates widgets (sliders, buttons, …) starting from symbolic expressions. It allows to better understand the influence of each parameters in a particular expression, without the knowledge of complicated widget libraries.