plotgrid
- spb.plotgrid.plotgrid(*args, **kwargs)[source]
Combine multiple plots into a grid-like layout. This function has two modes of operation, depending on the input arguments. Make sure to read the examples to fully understand them.
- Parameters
- argssequence (optional)
A sequence of aldready created plots. This, in combination with nr and nc represents the first mode of operation, where a basic grid with (nc * nr) subplots will be created.
- nr, ncint (optional)
Number of rows and columns. By default, nc = 1 and nr = -1: this will create as many rows as necessary, and a single column. By setting nr = 1 and nc = -1, it will create a single row and as many columns as necessary.
- gsdict (optional)
A dictionary mapping Matplotlib’s GridSpec objects to the plots. The keys represent the cells of the layout. Each cell will host the associated plot. This represents the second mode of operation, as it allows to create more complicated layouts.
- panel_kwdict (optional)
A dictionary of keyword arguments to be passed to panel’s GridSpec for further customization. Default to dict(sizing_mode=”stretch_width”). Refer to 1 for more information.
- showboolean (optional)
It applies only to Matplotlib figures. Default to True.
- Returns
- figplt.Figure or pn.GridSpec
If all input plots are instances of MatplotlibBackend, than a Matplotlib Figure will be returned. Otherwise an instance of Holoviz Panel’s GridSpec will be returned.
References
Examples
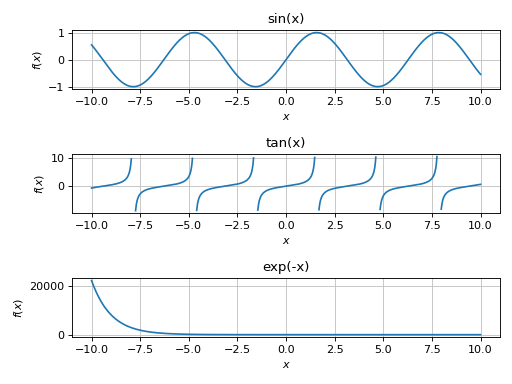
First mode of operation with instances of MatplotlibBackend:
from sympy import symbols, sin, cos, tan, exp, sqrt, Matrix, gamma, I
from spb import *

x, y, z = symbols("x, y, z")
p1 = plot(sin(x), backend=MB, title="sin(x)", show=False)
p2 = plot(tan(x), backend=MB, adaptive=False, detect_poles=True,
     title="tan(x)", show=False)
p3 = plot(exp(-x), backend=MB, title="exp(-x)", show=False)
fig = plotgrid(p1, p2, p3)
(Source code, png, hires.png, pdf)

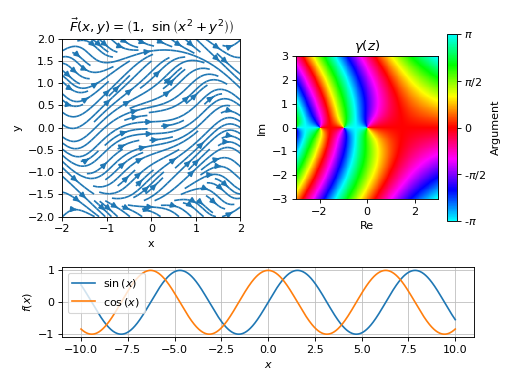
Second mode of operation, using Matplotlib GridSpec:
from sympy import *
from spb import *
from matplotlib.gridspec import GridSpec
x, y, z = symbols("x, y, z")
p1 = plot(sin(x), cos(x), adaptive=False, show=False)
expr = Tuple(1, sin(x**2 + y**2))
p2 = plot_vector(expr, (x, -2, 2), (y, -2, 2),
     streamlines=True, scalar=False, use_cm=False,
     title=r"$\vec{F}(x, y) = %s$" % latex(expr),
     xlabel="x", ylabel="y", show=False)
p3 = plot_complex(gamma(z), (z, -3-3*I, 3+3*I), title=r"$\gamma(z)$",
     grid=False, show=False)

gs = GridSpec(3, 4)
mapping = {
    gs[2, :]: p1,
    gs[0:2, 0:2]: p2,
    gs[0:2, 2:]: p3,
}
fig = plotgrid(gs=mapping)
(Source code, png, hires.png, pdf)