K3DBackend
- class spb.backends.k3d.K3DBackend(*args, **kwargs)[source]
A backend for plotting SymPy’s symbolic expressions using K3D-Jupyter.
- Parameters:
- cameralist, optional
A list of 9 numbers, namely:
x_cam, y_cam, z_cam: the position of the camera in the scenex_tar, y_tar, z_tar: the position of the target of the camerax_up, y_up, z_up: components of the up vector
- rendering_kwdict, optional
A dictionary of keywords/values which is passed to Matplotlib’s plot functions to customize the appearance of lines, surfaces, images, contours, quivers, streamlines… To learn more about customization:
Default options for line plots:
dict(width=0.1, shader="mesh"). Setuse_cm=Falseto switch to a solid color.Default options for quiver plots:
dict(scale = 1, pivot = "mid"). The keys to this dictionary are:scale: a float number acting as a scale multiplier.pivot: indicates the part of the arrow that is anchored to the X, Y, Z grid. It can be"tail", "mid", "middle", "tip".color: set a solid color by specifying an integer color, or a colormap by specifying one of k3d’s colormaps. If this key is not provided, a default color or colormap is used, depending on the value ofuse_cm.
Set
use_cm=Falseto switch to a default solid color.Default options for streamline plots:
dict( width=0.1, shader='mesh' ). Refer to k3d.line for more options. Setuse_cm=Falseto switch to a solid color.To customize surface plots, refers to:
k3d.mesh function for 3D surface and parametric surface plots.
k3d.marching_cubes function for 3D implicit plots.
- show_labelboolean, optional
Show/hide labels of the expressions. Default to False (labels not visible).
- use_cmboolean, optional
If True, apply a color map to the meshes/surface. If False, solid colors will be used instead. Default to True.
See also
Plot,MatplotlibBackend,PlotlyBackend,BokehBackend,plot3d
Notes
After the installation of this plotting module, try one of the examples of
plot3dwith this backend. If no figure is visible in the output cell, follow this procedure:Save the Notebook.
Close Jupyter server.
Run the following commands, which are going to install the Jupyter extension for K3D:
jupyter nbextension install –user –py k3d
jupyter nbextension enable –user –py k3d
Restart jupyter notebook
Open the previous notebook and execute the plot command.
- K3DBackend.fig
Returns the figure.
- spb.backends.k3d.K3DBackend.append(self, arg)
Adds an element from a plot’s series to an existing plot.
- Parameters:
- argBaseSeries
An instance of BaseSeries which will be used to generate the numerical data.
See also
Examples
Consider two Plot objects, p1 and p2. To add the second plot’s first series object to the first, use the append method, like so:
>>> from sympy import symbols
>>> from spb import plot
>>> x = symbols('x')
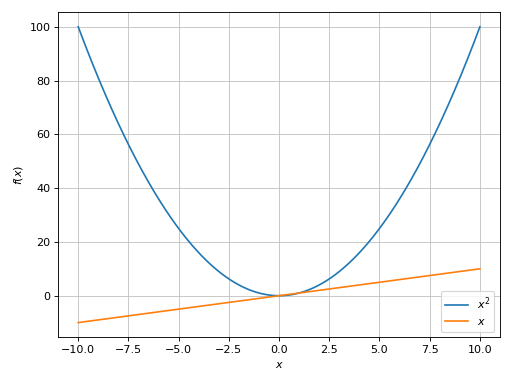
>>> p1 = plot(x*x, show=False)
>>> p2 = plot(x, show=False)
>>> p1.append(p2[0])
>>> p1
Plot object containing:
[0]: cartesian line: x**2 for x over (-10.0, 10.0)
[1]: cartesian line: x for x over (-10.0, 10.0)
>>> p1.show()
(
Source code,png)
- spb.backends.k3d.K3DBackend.extend(self, arg)
Adds all series from another plot.
- Parameters:
- argPlot or sequence of BaseSeries
See also
Examples
Consider two Plot objects, p1 and p2. To add the second plot to the first, use the extend method, like so:
>>> from sympy import symbols
>>> from spb import plot
>>> x = symbols('x')
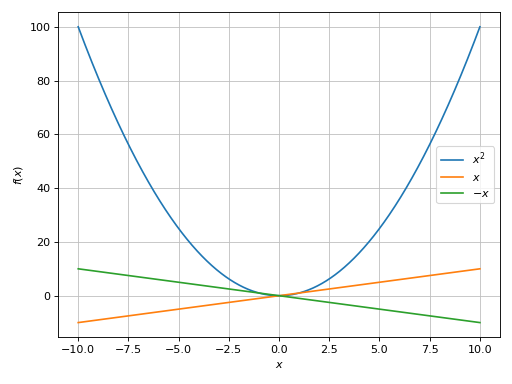
>>> p1 = plot(x**2, show=False)
>>> p2 = plot(x, -x, show=False)
>>> p1.extend(p2)
>>> p1
Plot object containing:
[0]: cartesian line: x**2 for x over (-10.0, 10.0)
[1]: cartesian line: x for x over (-10.0, 10.0)
[2]: cartesian line: -x for x over (-10.0, 10.0)
>>> p1.show()
(
Source code,png)
- spb.backends.k3d.K3DBackend.save(self, path, **kwargs)
Export the plot to a static picture or to an interactive html file.
Notes
K3D-Jupyter is only capable of exporting:
‘.png’ pictures: refer to [1] to visualize the available keyword arguments.
‘.html’ files: this requires the
msgpack[2] python module to be installed.When exporting a fully portable html file, by default the required Javascript libraries will be loaded with a CDN. Set
include_js=Trueto include all the javascript code in the html file: this will create a bigger file size, but can be run without internet connection.
References
- spb.backends.k3d.K3DBackend.show(self)
Visualize the plot on the screen.
- spb.backends.k3d.K3DBackend.update_interactive(self, params)
Implement the logic to update the data generated by interactive-widget plots.
- Parameters:
- paramsdict
Map parameter-symbols to numeric values.