Utils
- class spb.backends.utils.tick_formatter_multiples_of(*, label, n, n_minor, quantity, name)[source]
Create a tick formatter where each tick is a multiple of a quantity / n. This formatter is meant to be used directly by the backend classes (MB, BB, PB).
- Parameters:
- labelstr
Label associated to quantity to be shown on the ticks.
- nfloat
Denominator of the reference quantity for placing major grid lines. It must be: 0 ≤ n < ∞. Default value: 1.
- n_minorint
Number of minor ticks to be shown between two consecutive major ticks. It must be: 0 ≤ n_minor < ∞. Default value: 4.
- quantityNumber, Number, NumberSymbol
Numeric value of the base quantity.
Methods
BB_formatter()
Returns a bokeh
CustomJSTickFormatterin order to customize the tick labels.BB_ticker()
Returns a matplotlib
MultipleLocatorin order to locate major grid lines.MB_func_formatter()
Return a function to be used by matplotlib’s
FuncFormatterin order to customize the tick labels.MB_major_locator()
Returns a matplotlib
MultipleLocatorin order to locate major grid lines.MB_minor_locator()
Returns a matplotlib
MultipleLocatorin order to locate minor grid lines.PB_ticks(t_min, t_max, latex=False)
Return tick values and labels for multiples of quantity/n between t_min and t_max.
Notes
This implementation is really basic because it doesn’t consider the font size of the tick labels, nor the width of the tick labels, nor the spacing between them, nor the range being visualized, etc. It is up to the user to select an appropriate value of the parameter n in order to achieve properly spaced tick labels thus improving readability.
Examples
Consider a quantity, for example pi. Let’s suppose our region is limited to [-2*pi, 2*pi].
To get a major tick at multiples of pi, then n=1:
>>> from sympy import *
>>> from spb import tick_formatter_multiples_of, graphics, line
>>> tf = tick_formatter_multiples_of(quantity=pi, label="\pi", n=1)
>>> x = symbols("x")
>>> graphics(
...     line(cos(x), (x, -2*pi, 2*pi)),
...     x_ticks_formatter=tf
... )
(
Source code,png)
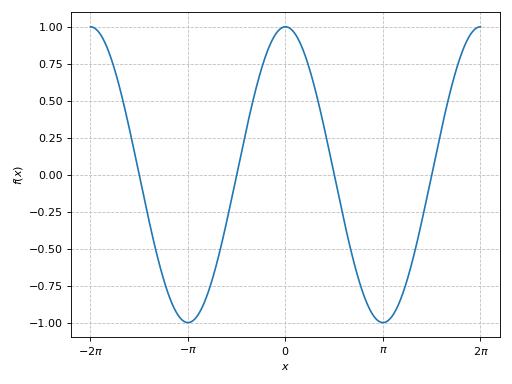
To get a major tick at multiples of 2*pi, than n=0.5:
>>> tf = tick_formatter_multiples_of(quantity=pi, label="\pi", n=0.5)
>>> graphics(
...     line(cos(x), (x, -2*pi, 2*pi)),
...     x_ticks_formatter=tf
... )
(
Source code,png)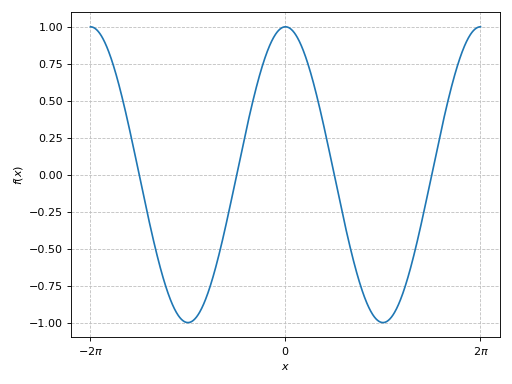
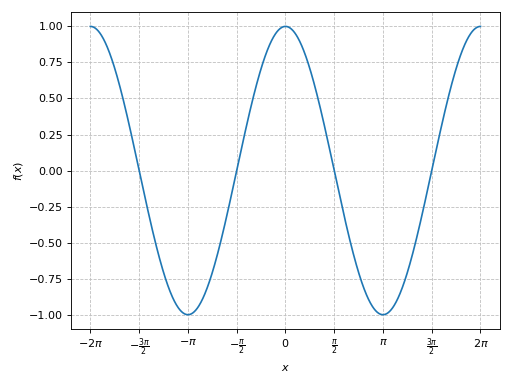
To get a major tick at multiples of pi / 2, then, n=2:
>>> tf = tick_formatter_multiples_of(quantity=pi, label="\pi", n=2)
>>> graphics(
...     line(cos(x), (x, -2*pi, 2*pi)),
...     x_ticks_formatter=tf
... )
(
Source code,png)
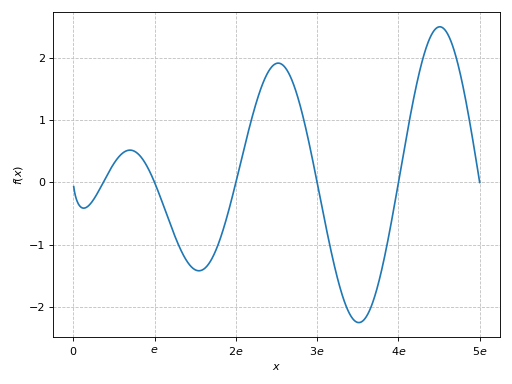
To get a major tick at multiples of e (Euler number):
>>> tf = tick_formatter_multiples_of(quantity=E, label="e", n=1)
>>> graphics(
...     line(sin(pi*x/E) * ln(x), (x, 0, 5*E)),
...     x_ticks_formatter=tf
... )
(
Source code,png)
- spb.backends.utils.multiples_of_2_pi(label='\\pi')[source]
Create a tick formatter where each tick is a multiple of 2*pi.
- spb.backends.utils.multiples_of_pi(label='\\pi')[source]
Create a tick formatter where each tick is a multiple of pi.
- spb.backends.utils.multiples_of_pi_over_2(label='\\pi')[source]
Create a tick formatter where each tick is a multiple of pi/2.