6 - Extending the module
This tutorial explains how to extend the plotting module when the plotting functions and/or the customization options are not enough to achieve the desired results.
We are only going to look at extending MatplotlibBackend (or MB),
as the procedure to modify other backends is the same.
Here is how the plotting module works:
a plotting function is called, receiving one or more symbolic expression, as well as keyword arguments to further customize the output.
inside the plotting function, one (or more) data series are instantiated for each symbolic expression. These will generate the numerical data.
then, a plot object is instantiated,
p, which receives the data series. For each data series, an appropriate renderer is created. A renderer contains the logic to visualize the numerical data on the chart, and keep it updated when a widget-plot is created.When
p.show()is executed, a new figure is created and a loop is run over the renderers to add the numerical data to the figure.
The structure of a renderer is described in Renderers.
Let’s say we want to create a new plotting function to fill the area between 2 symbolic expressions. Here is a commented code-block to achieve that goal:
from sympy.abc import x
from sympy import cos, sin, pi
from spb import MB
from spb.series import LineOver1DRangeSeries, BaseSeries
from spb.backends.matplotlib.renderers.renderer import MatplotlibRenderer
class FilledLineSeries(BaseSeries):
"""
Create a new data series to represent a filled area between 2 lines.
The base class must be BaseSeries.
"""
def __init__(self, expr1, expr2, var_start_end, **kwargs):
"""
Each symbolic expression is treated as a line. Hence, for each
symbolic expression this class creates a corresponding
LineOver1DRangeSeries.
Parameters
==========
expr1 : Expr
expr2 : Expr
var_start_end : 3-elements tuple
A tuple of the form (x, min_val, max_val), where x is the
symbol used on the symbolic expressions.
**kwargs :
Keyword arguments to be passed to LineOver1DRangeSeries
"""
# Very important: execute the base class __init__ method.
super().__init__(**kwargs)
# set a few attributes
self.label = kwargs.pop("label", str(expr1) + " to " + str(expr2))
self.series1 = LineOver1DRangeSeries(expr1, var_start_end, **kwargs)
self.series2 = LineOver1DRangeSeries(expr2, var_start_end, **kwargs)
def get_data(self):
"""Computes and returns the numerical data.
"""
x1, y1 = self.series1.get_data()
x2, y2 = self.series2.get_data()
return x1, y1, x2, y2
###########################################################################
######################### Rendering logic #################################
###########################################################################
def draw(renderer, data):
"""
Parameters
==========
renderer : an instance of MatplotlibRenderer
data : the numerical data to be shown
Returns
=======
handle :
A single Matplotlib's handle or a list of handles that
will be used by the `update` function in case of
interactive-widget plots.
"""
# A renderer exposes two attributes:
# 1. the data series, mainly used to access its attributes
# 2. the plot object where the numerical data will be added
p, s = renderer.plot, renderer.series
# numerical data returned by FilledLineSeries.get_data()
x1, y1, x2, y2 = data
# draw the numerical data to the figure
handle = p._ax.fill_between(x1, y1, y2, **s.rendering_kw)
# eventually add a legend entry
if s.show_in_legend:
proxy_artist = p.Rectangle((0, 0), 1, 1,
color=handle.get_facecolor(), label=s.label)
p._legend_handles.append(proxy_artist)
# return the handle so that it can later be updated with
# new data.
# NOTE: in this case only one handle is needed. If the
# visualization requires more objects, `handle` will be
# a list of handles.
return handle
def update(renderer, data, handle):
"""
Parameters
==========
renderer : an instance of MatplotlibRenderer
data : the numerical data to be shown
handle : the handle generated by draw()
"""
# logic to update the visualization
raise NotImplementedError
class FilledLineRenderer(MatplotlibRenderer):
"""Create a new renderer to display filled areas between lines.
"""
draw_update_map = {
draw: update
}
# let MatplotlibBackend knows that when a FilledLineSeries is encountered,
# it must be rendered with FilledLineRenderer
MB.renderers_map.update({FilledLineSeries: FilledLineRenderer})
###########################################################################
######################### Plot function logic #############################
###########################################################################
def plot_filled(from_to, x_range, **kwargs):
show = kwargs.get("show", True)
backend = kwargs.get("backend", MB)
# create data series
series = []
for (expr1, expr2) in from_to:
series.append(
FilledLineSeries(expr1, expr2, x_range, **kwargs)
)
# create the plot object
p = backend(*series, **kwargs)
if show:
p.show()
return p
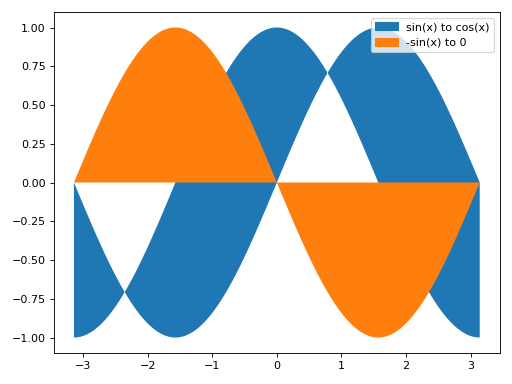
# example plotting two filled regions
plot_filled([(sin(x), cos(x)), (-sin(x), 0)], (x, -pi, pi), grid=False)
(Source code, png)