BokehBackend
- class spb.backends.bokeh.BokehBackend(*args, **kwargs)[source]
A backend for plotting SymPy’s symbolic expressions using Bokeh. This implementation only supports 2D plots.
- Parameters
- aspectstr
Set the aspect ratio of a 2D plot. Default to
None. Set it to"equal"to sets equal spacing on the axis.- rendering_kwdict, optional
A dictionary of keywords/values which is passed to Matplotlib’s plot functions to customize the appearance of lines, surfaces, images, contours, quivers, streamlines… To learn more about customization:
Refer to:
Default options for quiver plots:
dict(
    scale = 1,
    pivot = "mid",      # "mid", "tip" or "tail"
    arrow_heads = True,  # show/hide arrow
    line_width = 1
)
Default options for streamline plots:
dict(line_width=2, line_alpha=0.8)
- themestr, optional
Set the theme. Default to
"dark_minimal". Find more Bokeh themes at 2 .- update_eventbool, optional
If True, the backend will update the data series over the visibile range whenever a pan-event is triggered. Default to True.
- annotationslist, optional
A list of dictionaries specifying the type of annotation required. The keys in the dictionary should be equivalent to the arguments of the bokeh.models.LabelSet class. This feature is experimental. It might get removed in the future.
- markerslist, optional
A list of dictionaries specifying the type the markers required. The keys in the dictionary should be equivalent to the arguments of the bokeh.models.Scatter class. This feature is experimental. It might get removed in the future.
- rectangleslist, optional
A list of dictionaries specifying the dimensions of the rectangles to be plotted. The
"args"key must contain the bokeh.models.ColumnDataSource object containing the data. All other keyword arguments will be passed to the bokeh.models.Rect class. This feature is experimental. It might get removed in the future.- filldict, optional
A dictionary specifying the type of color filling required in the plot. The keys in the dictionary should be equivalent to the arguments of the bokeh.models.VArea class. This feature is experimental. It might get removed in the future.
See also
Plot,MatplotlibBackend,PlotlyBackend,K3DBackend
References
- 1
https://docs.bokeh.org/en/latest/docs/reference/plotting.html#bokeh.plotting.Figure.line
- 2
- 3
https://docs.bokeh.org/en/latest/docs/reference/plotting/figure.html#bokeh.plotting.Figure.scatter
- append(self, arg)
Adds an element from a plot’s series to an existing plot.
- Parameters
- argBaseSeries
An instance of BaseSeries which will be used to generate the numerical data.
See also
Examples
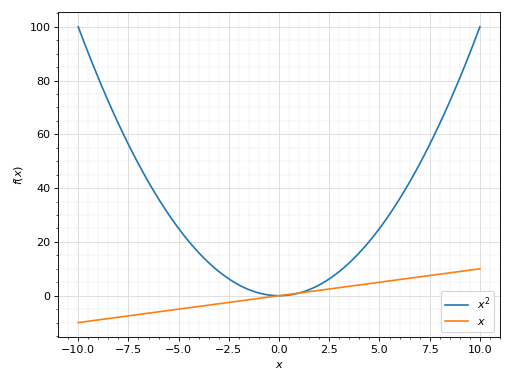
Consider two Plot objects, p1 and p2. To add the second plot’s first series object to the first, use the append method, like so:
>>> from sympy import symbols
>>> from spb import plot
>>> x = symbols('x')
>>> p1 = plot(x*x, show=False)
>>> p2 = plot(x, show=False)
>>> p1.append(p2[0])
>>> p1
Plot object containing:
[0]: cartesian line: x**2 for x over (-10.0, 10.0)
[1]: cartesian line: x for x over (-10.0, 10.0)
>>> p1.show()
(Source code, png, hires.png, pdf)
- spb.backends.bokeh.BokehBackend.extend(self, arg)
Adds all series from another plot.
- Parameters
- argPlot or sequence of BaseSeries
See also
append
Examples
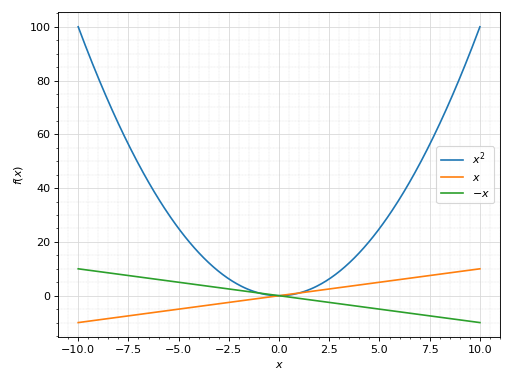
Consider two Plot objects, p1 and p2. To add the second plot to the first, use the extend method, like so:
>>> from sympy import symbols
>>> from spb import plot
>>> x = symbols('x')
>>> p1 = plot(x**2, show=False)
>>> p2 = plot(x, -x, show=False)
>>> p1.extend(p2)
>>> p1
Plot object containing:
[0]: cartesian line: x**2 for x over (-10.0, 10.0)
[1]: cartesian line: x for x over (-10.0, 10.0)
[2]: cartesian line: -x for x over (-10.0, 10.0)
>>> p1.show()
(Source code, png, hires.png, pdf)

- spb.backends.bokeh.BokehBackend.save(self, path, **kwargs)
Export the plot to a static picture or to an interactive html file.
Refer to 4 and 5 to visualize all the available keyword arguments.
Notes
In order to export static pictures, the user also need to install the packages listed in 6.
When exporting a fully portable html file, by default the necessary Javascript libraries will be loaded with a CDN. This creates the smallest file size possible, but it requires an internet connection in order to view/load the file and its dependencies.
References
- spb.backends.bokeh.BokehBackend.show(self)
Visualize the plot on the screen.