PlotlyBackend
- class spb.backends.plotly.PlotlyBackend(*args, **kwargs)[source]
A backend for plotting SymPy’s symbolic expressions using Plotly.
- Parameters
- aspectstr, optional
Set the aspect ratio of the plot. Default to
"auto". Possible values:"equal": sets equal spacing on the axis of a 2D plot.For 3D plots:
"cube": fix the ratio to be a cube"data": draw axes in proportion to the proportion of their ranges"auto": automatically produce something that is well proportioned using ‘data’ as the default.manually set the aspect ratio by providing a dictionary. For example:
dict(x=1, y=1, z=2)forces the z-axis to appear twice as big as the other two.
- rendering_kwdict, optional
A dictionary of keywords/values which is passed to Matplotlib’s plot functions to customize the appearance of lines, surfaces, images, contours, quivers, streamlines… To learn more about customization:
Refer to 7 to customize surface plots.
Refer to 12 to customize implicit surface plots.
Refer to 5 to customize 2D quiver plots. Default to:
dict( scale = 0.075 ).Refer to 6 to customize 3D cone plots. Default to:
dict( sizemode = "absolute", sizeref = 40 ).Refer to 8 to customize 2D streamlines plots. Defaul to:
dict( arrow_scale = 0.15 ).Refer to 9 to customize 3D streamlines plots. Defaul to:
dict( sizeref = 0.3 ).
- themestr, optional
Set the theme. Default to
"plotly_dark". Find more Plotly themes at 10 .- use_cmboolean, optional
If True, apply a color map to the meshes/surface. If False, solid colors will be used instead. Default to True.
- annotationslist, optional
A list of dictionaries specifying the type the markers required. The keys in the dictionary should be equivalent to the arguments of the Plotly’s graph_objects.Scatter class. Refer to 13 for more information. This feature is experimental. It might get removed in the future.
- markerslist, optional
A list of dictionaries specifying the type the markers required. The keys in the dictionary should be equivalent to the arguments of the Plotly’s graph_objects.Scatter class. Refer to 3 for more information. This feature is experimental. It might get removed in the future.
- rectangleslist, optional
A list of dictionaries specifying the dimensions of the rectangles to be plotted. The keys in the dictionary should be equivalent to the arguments of the Plotly’s graph_objects.Figure.add_shape function. Refer to 14 for more information. This feature is experimental. It might get removed in the future.
- filldict, optional
A list of dictionaries specifying the type the markers required. The keys in the dictionary should be equivalent to the arguments of the Plotly’s graph_objects.Scatter class. Refer to 15 for more information. This feature is experimental. It might get removed in the future.
See also
Plot,MatplotlibBackend,BokehBackend,K3DBackend
Notes
A few bugs related to Plotly might prevent the correct visualization:
with 2D domain coloring, the vertical axis is reversed, with negative values on the top and positive values on the bottom.
with 3D complex plots: when hovering a point, the tooltip will display wrong information for the argument and the phase. Hopefully, this bug 11 will be fixed upstream.
References
- spb.backends.plotly.PlotlyBackend.append(self, arg)
Adds an element from a plot’s series to an existing plot.
- Parameters
- argBaseSeries
An instance of BaseSeries which will be used to generate the numerical data.
See also
Examples
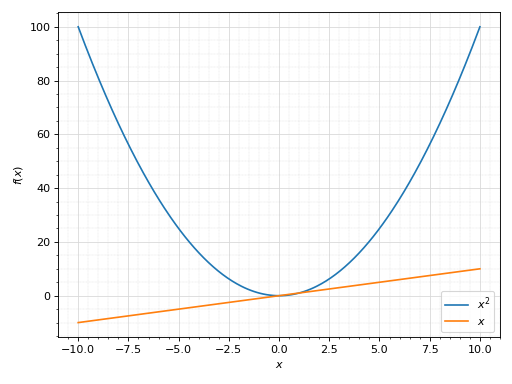
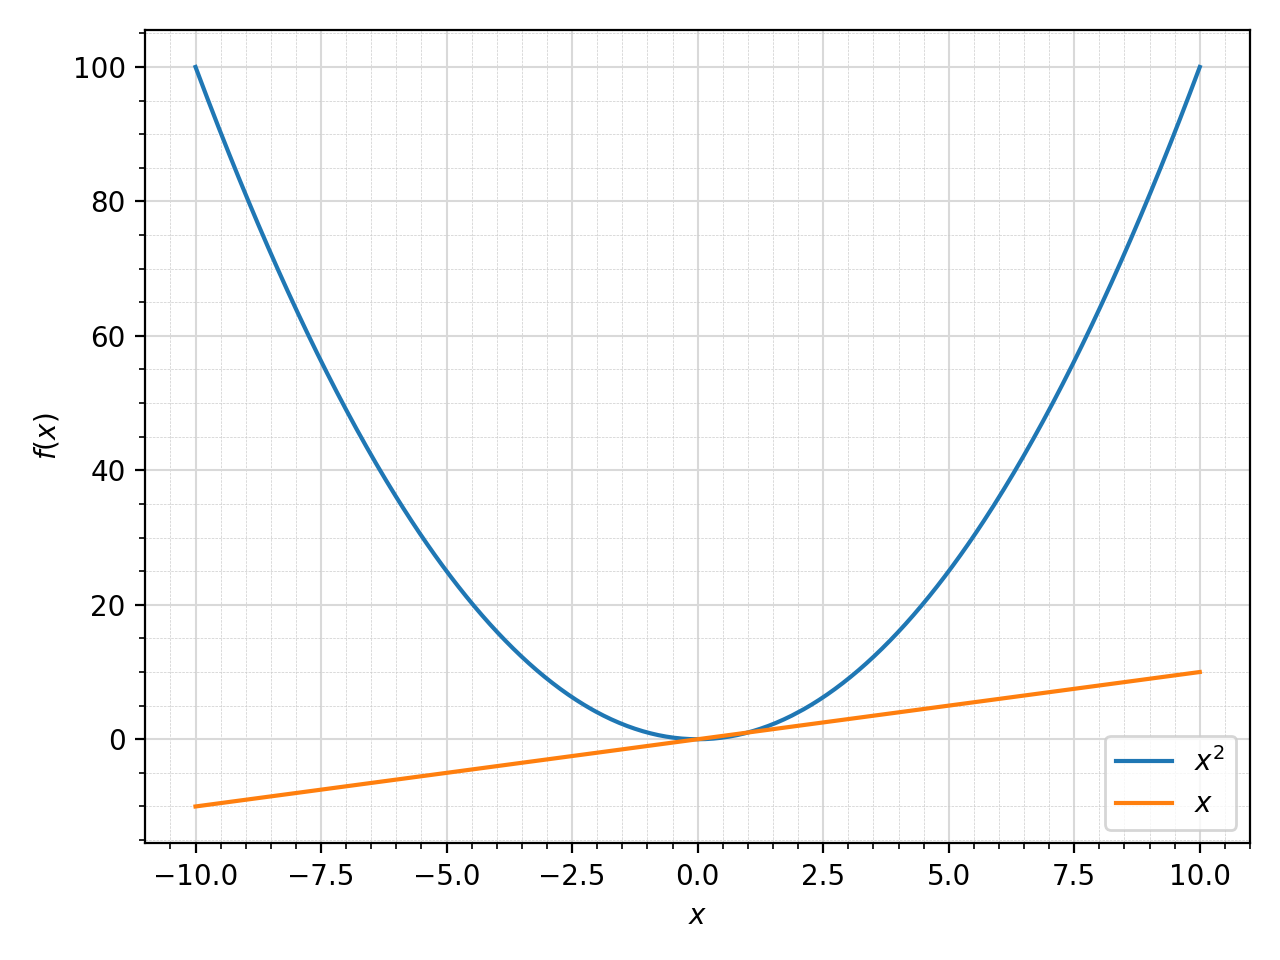
Consider two Plot objects, p1 and p2. To add the second plot’s first series object to the first, use the append method, like so:
>>> from sympy import symbols
>>> from spb import plot
>>> x = symbols('x')
>>> p1 = plot(x*x, show=False)
>>> p2 = plot(x, show=False)
>>> p1.append(p2[0])
>>> p1
Plot object containing:
[0]: cartesian line: x**2 for x over (-10.0, 10.0)
[1]: cartesian line: x for x over (-10.0, 10.0)
>>> p1.show()
(Source code, png, hires.png, pdf)
- spb.backends.plotly.PlotlyBackend.extend(self, arg)
Adds all series from another plot.
- Parameters
- argPlot or sequence of BaseSeries
See also
Examples
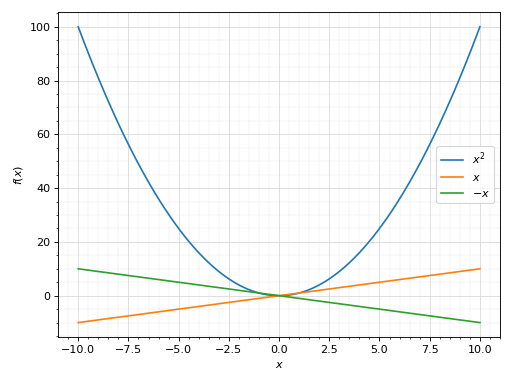
Consider two Plot objects, p1 and p2. To add the second plot to the first, use the extend method, like so:
>>> from sympy import symbols
>>> from spb import plot
>>> x = symbols('x')
>>> p1 = plot(x**2, show=False)
>>> p2 = plot(x, -x, show=False)
>>> p1.extend(p2)
>>> p1
Plot object containing:
[0]: cartesian line: x**2 for x over (-10.0, 10.0)
[1]: cartesian line: x for x over (-10.0, 10.0)
[2]: cartesian line: -x for x over (-10.0, 10.0)
>>> p1.show()
(Source code, png, hires.png, pdf)

- spb.backends.plotly.PlotlyBackend.save(self, path, **kwargs)
Export the plot to a static picture or to an interactive html file.
Refer to 16 and 17 to visualize all the available keyword arguments.
Notes
In order to export static pictures, the user also need to install the packages listed in 16.
References
- spb.backends.plotly.PlotlyBackend.show(self)
Visualize the plot on the screen.