MatplotlibBackend
- class spb.backends.matplotlib.MatplotlibBackend(*args, **kwargs)[source]
A backend for plotting SymPy’s symbolic expressions using Matplotlib.
- Parameters
- aspect(float, float) or str, optional
Set the aspect ratio of a 2D plot. Possible values:
'auto': Matplotlib will fit the plot in the vibile area."equal": sets equal spacing on the axis of a 2D plot.tuple containing 2 float numbers, from which the aspect ratio is computed.
- axis_center(float, float) or str or None, optional
Set the location of the intersection between the horizontal and vertical axis in a 2D plot. It can be:
None: traditional layout, with the horizontal axis fixed on the bottom and the vertical axis fixed on the left. This is the default value.a tuple
(x, y)specifying the exact intersection point.'center': center of the current plot area.'auto': the intersection point is automatically computed.
- rendering_kwdict, optional
A dictionary of keywords/values which is passed to Matplotlib’s plot functions to customize the appearance of lines, surfaces, images, contours, quivers, streamlines… To learn more about customization:
- use_cmboolean, optional
If True, apply a color map to the mesh/surface or parametric lines. If False, solid colors will be used instead. Default to True.
- annotationslist, optional
A list of dictionaries specifying the type of annotation required. The keys in the dictionary should be equivalent to the arguments of the matplotlib.axes.Axes.annotate method. This feature is experimental. It might get removed in the future.
- markerslist, optional
A list of dictionaries specifying the type the markers required. The keys in the dictionary should be equivalent to the arguments of the matplotlib.pyplot.plot() function along with the marker related keyworded arguments. This feature is experimental. It might get removed in the future.
- rectangleslist, optional
A list of dictionaries specifying the dimensions of the rectangles to be plotted. The keys in the dictionary should be equivalent to the arguments of the matplotlib.patches.Rectangle class. This feature is experimental. It might get removed in the future.
- filldict, optional
A dictionary specifying the type of color filling required in the plot. The keys in the dictionary should be equivalent to the arguments of the matplotlib.axes.Axes.fill_between method. This feature is experimental. It might get removed in the future.
See also
Plot,PlotlyBackend,BokehBackend,K3DBackend
References
- 1
https://matplotlib.org/stable/api/_as_gen/matplotlib.pyplot.contourf.html
- 2
https://matplotlib.org/stable/api/_as_gen/matplotlib.pyplot.imshow.html
- 3
https://matplotlib.org/stable/api/_as_gen/matplotlib.pyplot.plot.html
- 4
https://matplotlib.org/stable/api/collections_api.html#matplotlib.collections.LineCollection
- 5
https://matplotlib.org/stable/api/quiver_api.html#module-matplotlib.quiver
- 6
- 7
- spb.backends.matplotlib.MatplotlibBackend.append(self, arg)
Adds an element from a plot’s series to an existing plot.
- Parameters
- argBaseSeries
An instance of BaseSeries which will be used to generate the numerical data.
See also
Examples
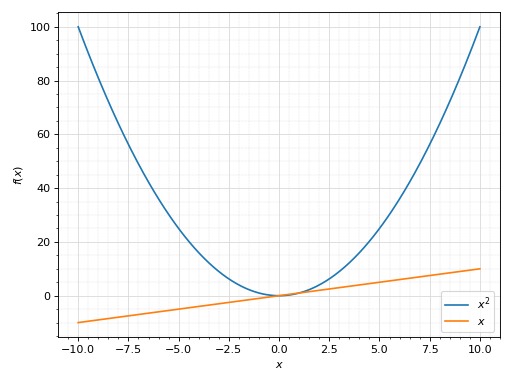
Consider two Plot objects, p1 and p2. To add the second plot’s first series object to the first, use the append method, like so:
>>> from sympy import symbols
>>> from spb import plot
>>> x = symbols('x')
>>> p1 = plot(x*x, show=False)
>>> p2 = plot(x, show=False)
>>> p1.append(p2[0])
>>> p1
Plot object containing:
[0]: cartesian line: x**2 for x over (-10.0, 10.0)
[1]: cartesian line: x for x over (-10.0, 10.0)
>>> p1.show()
(Source code, png, hires.png, pdf)
- spb.backends.matplotlib.MatplotlibBackend.close(self)
Close the current plot.
- spb.backends.matplotlib.MatplotlibBackend.extend(self, arg)
Adds all series from another plot.
- Parameters
- argPlot or sequence of BaseSeries
See also
Examples
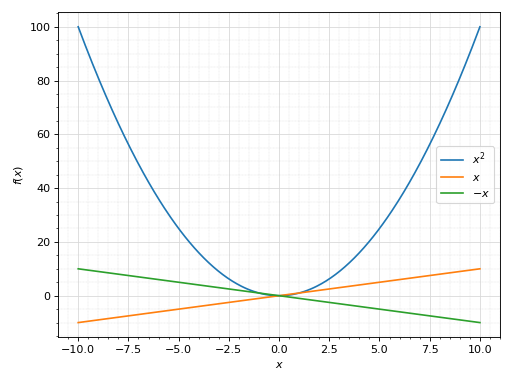
Consider two Plot objects, p1 and p2. To add the second plot to the first, use the extend method, like so:
>>> from sympy import symbols
>>> from spb import plot
>>> x = symbols('x')
>>> p1 = plot(x**2, show=False)
>>> p2 = plot(x, -x, show=False)
>>> p1.extend(p2)
>>> p1
Plot object containing:
[0]: cartesian line: x**2 for x over (-10.0, 10.0)
[1]: cartesian line: x for x over (-10.0, 10.0)
[2]: cartesian line: -x for x over (-10.0, 10.0)
>>> p1.show()
(Source code, png, hires.png, pdf)

- spb.backends.matplotlib.MatplotlibBackend.save(self, path, **kwargs)
Save the current plot at the specified location.
Refer to 8 to visualize all the available keyword arguments.
References
- spb.backends.matplotlib.MatplotlibBackend.show(self)
Display the current plot.